It is kind of odd to be announcing 2020 election outcomes based on what happened four years later in 2024, but the additional data points we are now getting make it clear that 2020 was scam of the century, well at least a second place scam after COVID. The note from 9th Nov shows some simple graphs, where anomalies stick out like sore thumbs. The crucial data we got in 2024 is that the phantasmagorical increase in 2020 Democrat votes actually largely (55%) evaporated into 2024. At that point we went from 2020 numbers that had a vanishingly small chance of being true (2% approximately) to being fraudulent. Some gung-ho readers might dismiss this as obvz, but there is a lot of value to be gained from really nailing down the size of the probable fraud and what would have happened without the ballot stuffing.
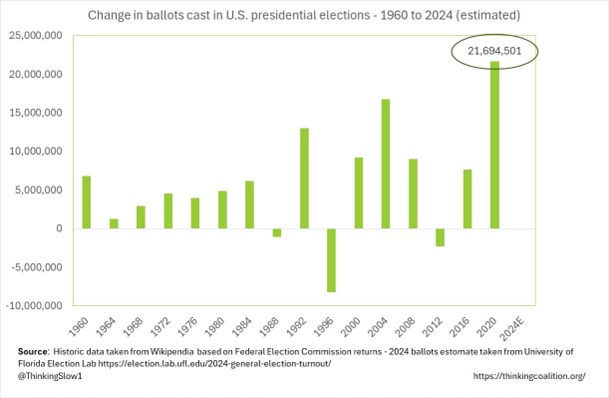
In the earlier paper I showed the smoking gun was the increase of 21.8 million total ballots in 2020, which was around 4x the average increase since 19601. Part of that increase then reversed in 2024 (3.5 million fewer ballots) which really exposed the 2020 ballot stuffing.
Note I am talking here about a top-down analysis where you see numbers that are mathematically highly improbable. This isn’t a bottom-up picture based on individual pieces of evidence.
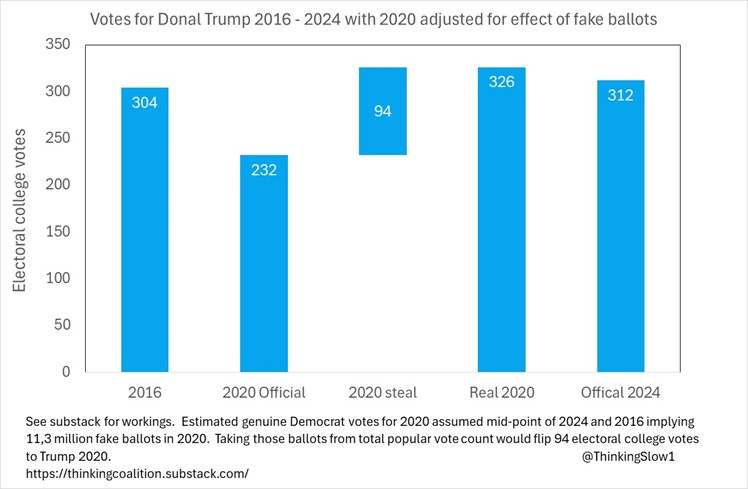
The chart shows my final output, the 2020 official outcome for Trump changes from 232 electoral college votes to 326 electoral college votes an increase of 94 votes, which would represent a massive win (winning like we’ve never won before, as the man would say) and a less erratic and much more believable time series 2016 to 2024.
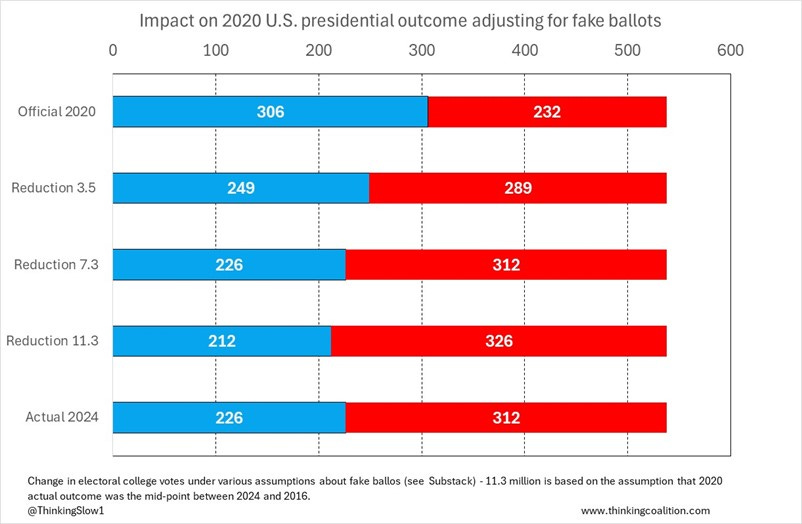
I illustrate the impact of three possible scenarios for the number of fake ballots in 2020.
S1 – The reduction in the popular vote for the whole of the U.S. for 2024 (3.5 million, provisional) assumes that these represent fake 2020 ballots which were not recreated for 2024. This also implies zero organic growth 2020 to 2024, so the entire change is due to the removal of false ballots.
S2 - The 7.3 million votes that Kamal Harris lost in 2024 compared to Joe Biden in 2020 are the result of fake ballots in 2020 which did not subsequently appear in 2024.
S 3- Actual 2020 results can be estimated as a mid-point between 2016 and 2024, a reduction of 11.3 million ballots (circle below). For the sake of completeness this method also suggests excess votes for Republicans in 2020.
It is reasonably easy to see those data points in the chart below.
Note that the movement in total ballots for 2024 is still changing as the total ballot number is estimated by University of Florida, who are still revising figures within a narrow range2.
The third scenario feels like the most realistic, but generates a hard to believe 11.3 million fake vote estimate. I am assuming for 2020 that the Republican vote was valid, even though the increase in their vote to 2020 was also unusually high. Critically the trend established in 2020 continued into 2024 rather than reversing. Also voter identification and vote counting seems to be much stricter in Republican states.
It is important to remember that in the context of 158.4 million votes in 2020, the margins are wafer thin in swing states – just a few thousand votes can swing a state and change the outcome.
The main assumption that I made is that deleting a winning margin in one state, say Arizona with 10,500 ballots implies that your national vote is reduced in line with the vote share of Arizona. So if Arizona is 2% of the Democrat’s nationwide vote then a 10,500 fall in votes in Arizona implies a drop of 210,000 nationally. So starting with 3.5 million votes to delete, I look at the states which require the smallest national vote change to flip. This move starts from Georgia and moves along as states require an bigger reduction in votes to flip.
The scenarios then generate these electoral vote outcomes.
Using some reasonable assumptions, it is possible to illustrate a picture where the actual outcome for Trump in 2020 was 326 seats (S3), an increase of 94 seats over the officially certified result. Even the lowest estimate of falsified votes of 3.5 million is enough to flip 57 electoral votes to Trump which already increases electoral votes to more than the 270 winning vote threshold.
For the sake of completeness, I note that the legal claims pursued by Sidney Powell were not successful.
Key context
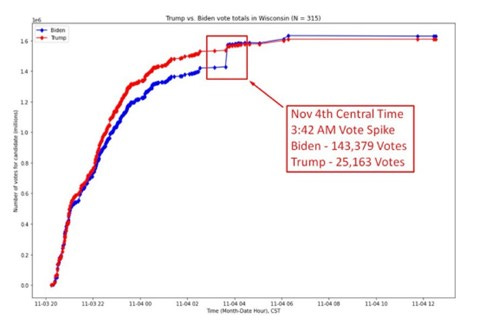
Creating the claimed 11.3 million false ballots would require a military style operation and would require people in high places turning a blind eye to this operation. I am suggesting that not only were those infamous relatively small blips at 03:00 suspicious, but the base line curves were already inflated. The 03:00 ballot dump was just a small push to get over the line on already inflated numbers3.
One interesting piece of corroborating evidence if from Judicial Watch, a U.S. NGO who is involved in extensive litigation with the government. They claim to have cleansed four million false voter records from the register. In addition, they have also successfully overturned state court decisions which allowed ballots to be received after voting day. They claim that their efforts helped to “stop the steal in 2024”4.
Another interesting piece of data are the traffic figures for U-haul which show that Democrat run states are seeing an enormous exodus of people, jokingly referred to as Leftugees5. This voting with their feet is then entirely consistent with the proposition that Biden was not especially popular in 2020 and his claimed unprecedented increase in votes was partially fictitious.
Democrat manged states are generally unwilling to introduce verification safeguards, thus making it easier to carry out large scale fraud.
Closing down this issue
Some may say that it is preposterous to suggest that senior players in the political system actually facilitated vote fraud to the tune of 11.3 million ballots. If you understand the scale of the COVID fraud, you will accept that the Deep State’s dishonesty is unlimited. In addition, ballot stuffing has been the norm throughout history. In Quigley’s Tragedy and Hope, he describes the operation of the Japanese Meiji oligarchy: “In case of need, they did not hesitate to use these instruments…and reporting, through the prefects, as elected candidates who had clearly failed to obtain the largest vote.” You might want to dismiss that as being a long time ago, but I wouldn’t like to bet on the integrity of Joe Biden and his Democrat Party operatives being any better.
So based on some simple maths I can show that Donald Trump almost certainly (90%) won the 2020 presidential election and in my preferred scenario (S3) he would have obtained 326 seats compared to the 232 officially recorded. Also the resulting pattern of 304, 326 and 312 feels a lot more credible than the official version.
Let me have your thoughts below (I’ve opened them to free subscribers) and please don’t forget to circulate our material and support our work, I hope you appreciate that it requires a lot of analysis to presents important and serious facts which are not to be found in the mainstream media, or in the bulk of the alternative media.
Alex Kriel is by training a physicist and was one of the first people to highlight the flawed nature of the Imperial COVID model6, he is a founder of the Thinking Coalition which comprises a group of citizens who are concerned about Government overreach (www.thinkingcoalition.com)
https://election.lab.ufl.edu/2024-general-election-turnout/
https://www.rermag.com/news-analysis/headline-news/article/21280283/texas-and-florida-top-us-destinations-for-one-way-u-haul-trailer-rentals-in-2023




Excellent analysis Alex. Add to that the more than 100% turnout in several counties, the dead people voting, the illegals voting, the vote flipping machines, the list goes on.
Good to see you digging into this. Would sceptics of the steal in 2020 not point towards similar changes in votes down on your graph during the 90s?